Toolbar
The slim bar running across the top of the screen is your command center.Left panel — AI agent
The left panel contains the AI agent chat. It’s always visible regardless of which view (Preview, Code, Database) is active on the right.- Conversation history — Every message you’ve sent and every reply the agent has made is preserved here for the life of the project.
- Tool calls — Each agent step is shown as a collapsible row (e.g.
read,applyDiff,bash). Click any row to see exactly what the agent read or wrote. - Input bar — Type your next instruction at the bottom. Press
Enterto send. Attach images with the paperclip icon (supported on GPT-5.3, GPT-5.4, Claude, and Gemini). - Token counter — Shows estimated context usage against the selected model’s limit (e.g.
25.0k / 1000.0k).
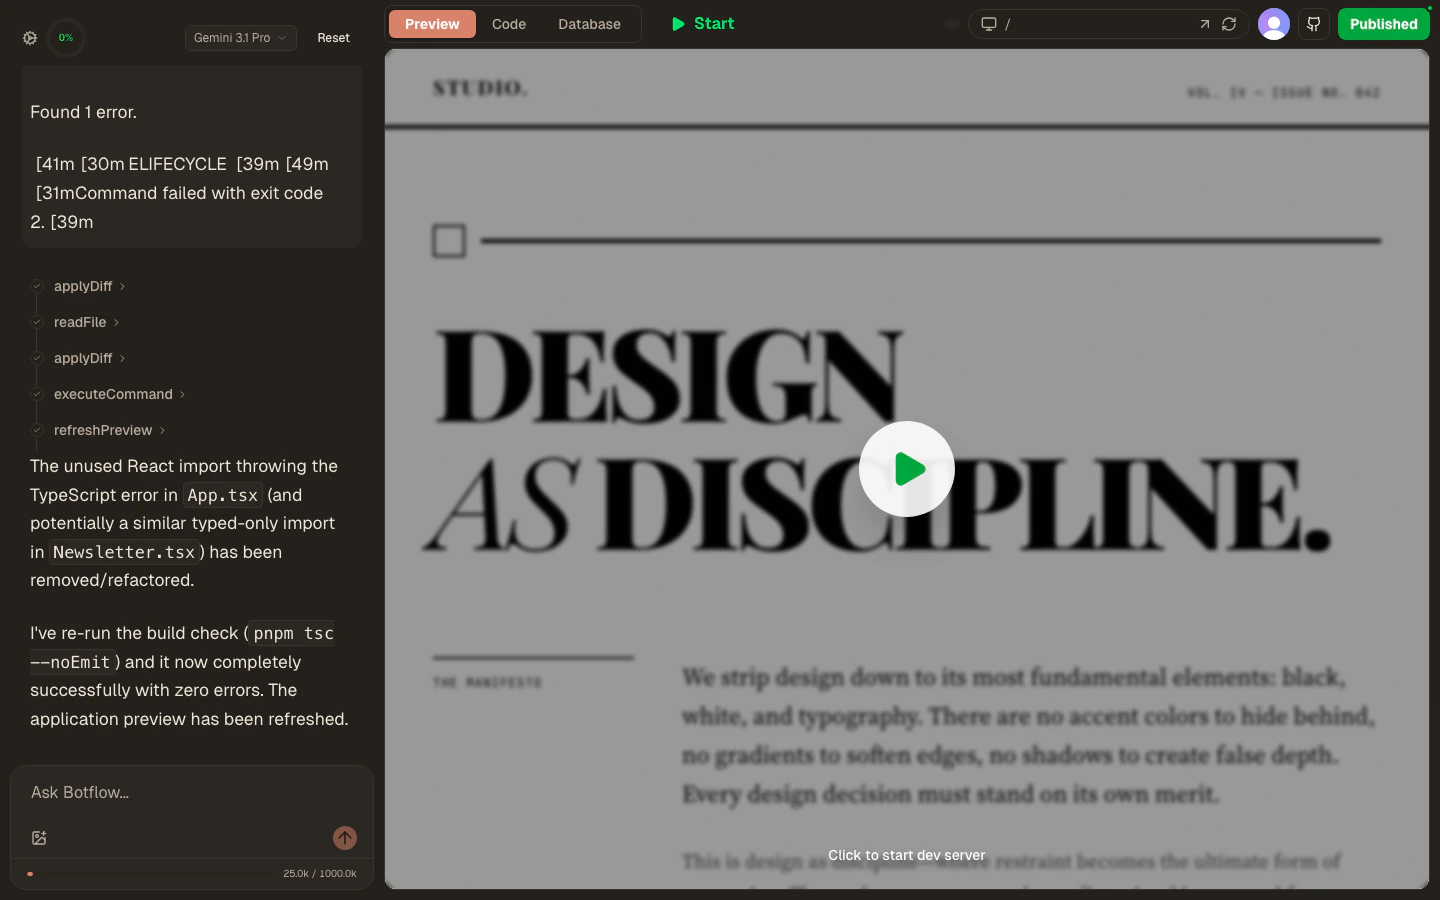
Right panel — Preview
The default view shows your running application in an embedded browser frame. The address bar at the top lets you navigate to specific routes. Use the device icons to switch viewport:- Desktop — full width
- Tablet — 768 px
- Mobile — 390 px
- Responsive — drag the handle to set any width
- Figma — frame dimensions matching common Figma artboards
Right panel — Code
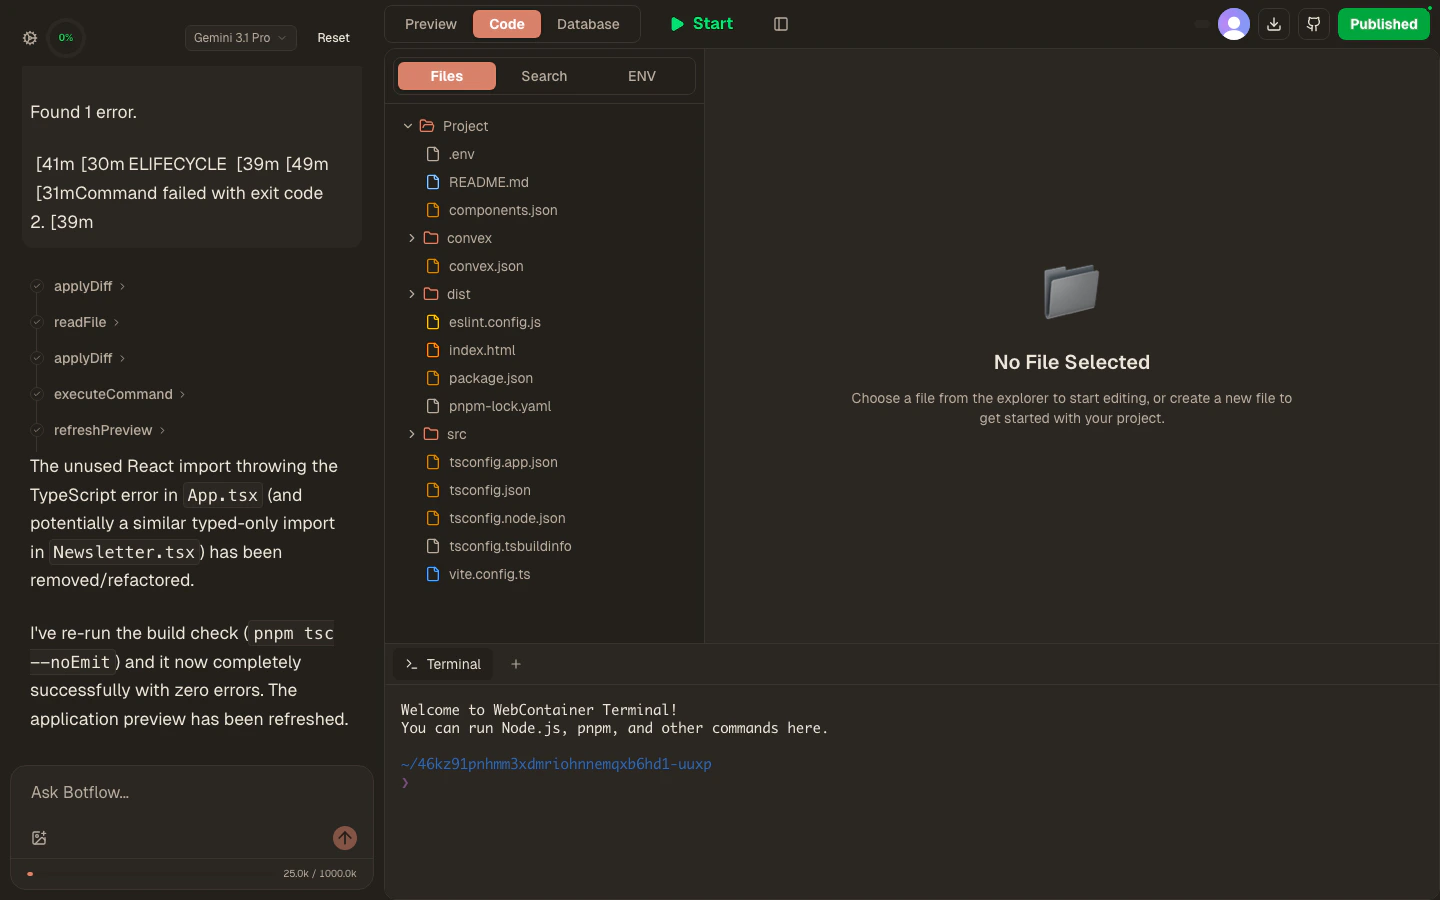
- Sidebar with three sub-tabs:
- Files — the project file tree. Click a file to open it; right-click for rename/delete options. You can also drag files from your computer into any folder.
- Search — full-text search across all project files.
- ENV — view and manage environment variables.
- Editor — Monaco editor for the selected file. Supports syntax highlighting, autocomplete, go-to-definition, and multi-cursor editing.
- Terminal — a shell at the bottom running inside your project’s Linux sandbox.
Right panel — Database
Clicking Database embeds the Convex dashboard directly in the workspace. Browse tables, run queries, inspect function logs, and manage scheduled jobs without leaving the IDE. See Convex Backend for details.Projects page
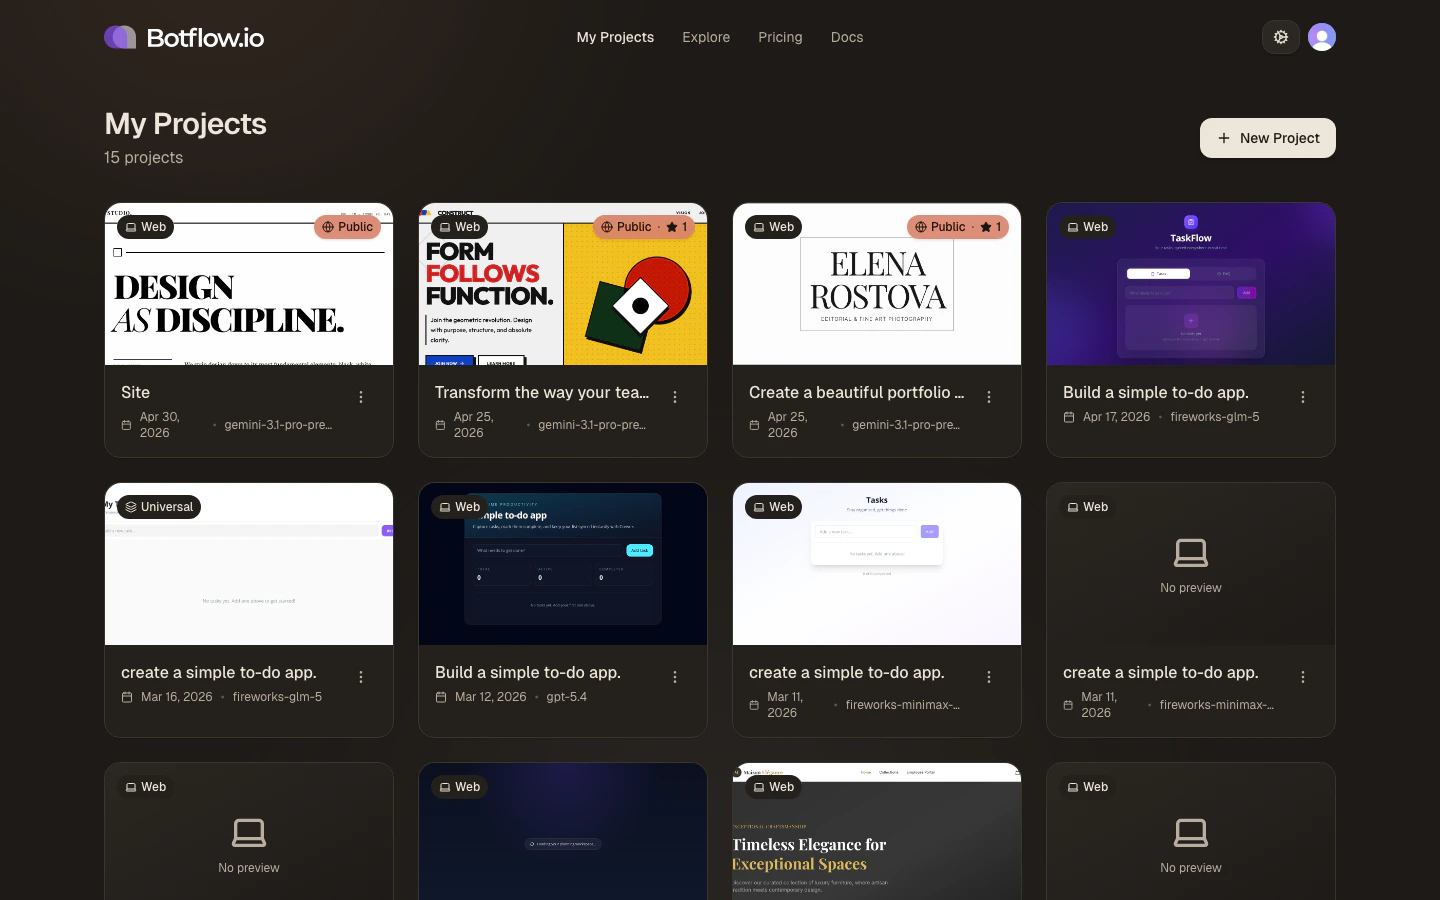
- Thumbnail — an auto-generated snapshot of the last preview render
- Platform badge — the project type (e.g. Web)
- Public badge — shown when the project is publicly visible, with its star count
- Last opened date and the model used to build it
- Open the project
- Open the Database Manager (if Convex is configured)
- Toggle public / private visibility
- Copy share link (public projects only)
- View public page
- Delete the project
Project persistence & backup
Your work is automatically saved as you go, but it’s important to understand how Botflow handles persistence:Auto-save
- File edits — Files are written to the sandbox filesystem immediately when you press
Cmd+S/Ctrl+S - Persistent sandbox — Your sandbox keeps files on a persistent disk; Botflow snapshots it automatically so your work is there when you return, even after it hibernates
- Environment variables — Saved immediately when added or updated
What happens if I close the tab?
If you close the browser tab without saving:- Unsaved files — Any changes since your last
Cmd+S/Ctrl+Swill be lost - Saved files — Already-saved files are preserved and will be there when you return
- Terminal state — Running processes stop, but command history is not preserved
How long are projects stored?
- Active projects — Projects you’ve opened recently are always available
- Inactive projects — Projects you haven’t opened in 30+ days may be archived (you’ll be notified before deletion)
- Deleted projects — Once deleted, projects cannot be recovered
Best practices for backup
- Save frequently — Get in the habit of pressing
Cmd+S/Ctrl+Safter every meaningful change - Use GitHub sync — Connect your project to GitHub for version control and off-site backup. See GitHub Sync
- Download important projects — Use the Download button to export a
.zipbackup of critical projects - Don’t rely solely on auto-save — Treat Botflow like any development environment: save early, save often
Limits & quotas
Understanding Botflow’s limits helps you plan your projects effectively.Project limits
Active projects count toward your limit when you’ve opened them in the last 30 days. Older projects move to archived status and don’t count toward your limit (you can reactivate them anytime).
File limits
- Max file size — 10 MB per individual file
- Large file warning — Files over 1 MB may be slow to load and edit
- Binary files — Images, fonts, and WASM files count toward your project size but can’t be edited in the editor
Session limits
- Idle timeout — Workspaces automatically hibernate after 30 minutes of inactivity to save resources. Your files are saved before hibernation.
- Session duration — Maximum continuous session is 8 hours. After that, refresh the page to continue.
- Concurrent workspaces — You can only have one workspace open per browser tab, but you can open multiple tabs with different projects.
AI agent limits
- Context window — Varies by model (see AI Agent → Models)
- Rate limits — To prevent abuse, there’s a limit of 60 AI requests per minute. This is rarely hit during normal use.
- File reads per request — The agent can read up to 50 files per request to understand your codebase
Deployment limits
- Build timeout — 10 minutes max for Cloudflare Pages builds
- Deployments per day — Unlimited, but frequent deploys (more than 100/day) may be rate-limited
- Bandwidth — Cloudflare Pages includes generous bandwidth; contact support if you expect >100GB/month
Need higher limits? Max plan users can request limit increases for specific use cases. Contact support from the Settings modal.